Imitating Sol LeWitt's Wall Drawing #1136 in Javascript
See the finished product here
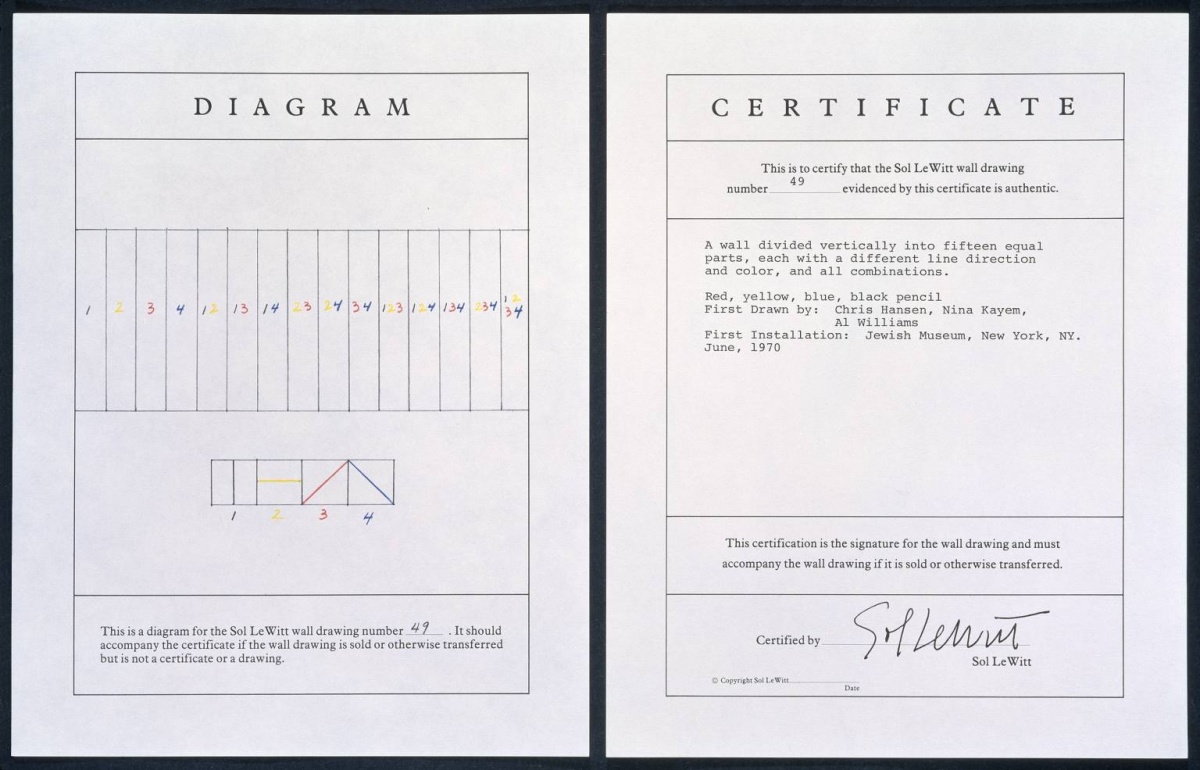
Each of Sol LeWitt's "wall drawings" consists of a short set of instructions, sometimes with an accompanying diagram, that instructs the "owner" on how to implement the work; Sol usually did not execute his own work, but rather the "art" consisted in the concept. Here is an example instruction:
A few years ago, I found Brad Bouse's excellent Solving Sol website, which asks users to implement some of these wall drawings in the browser. I tried a few, and got hooked because iplmenting a wall drawing was a pleasing, easy way to kill a few hours.
Here are my interpretations of wall drawing 11, 16, 46, 49 and 130.
Almost exactly one year ago today, I saw Wall Drawing 1136 and decided to take it on. Here it is, as installed at the Tate Modern:
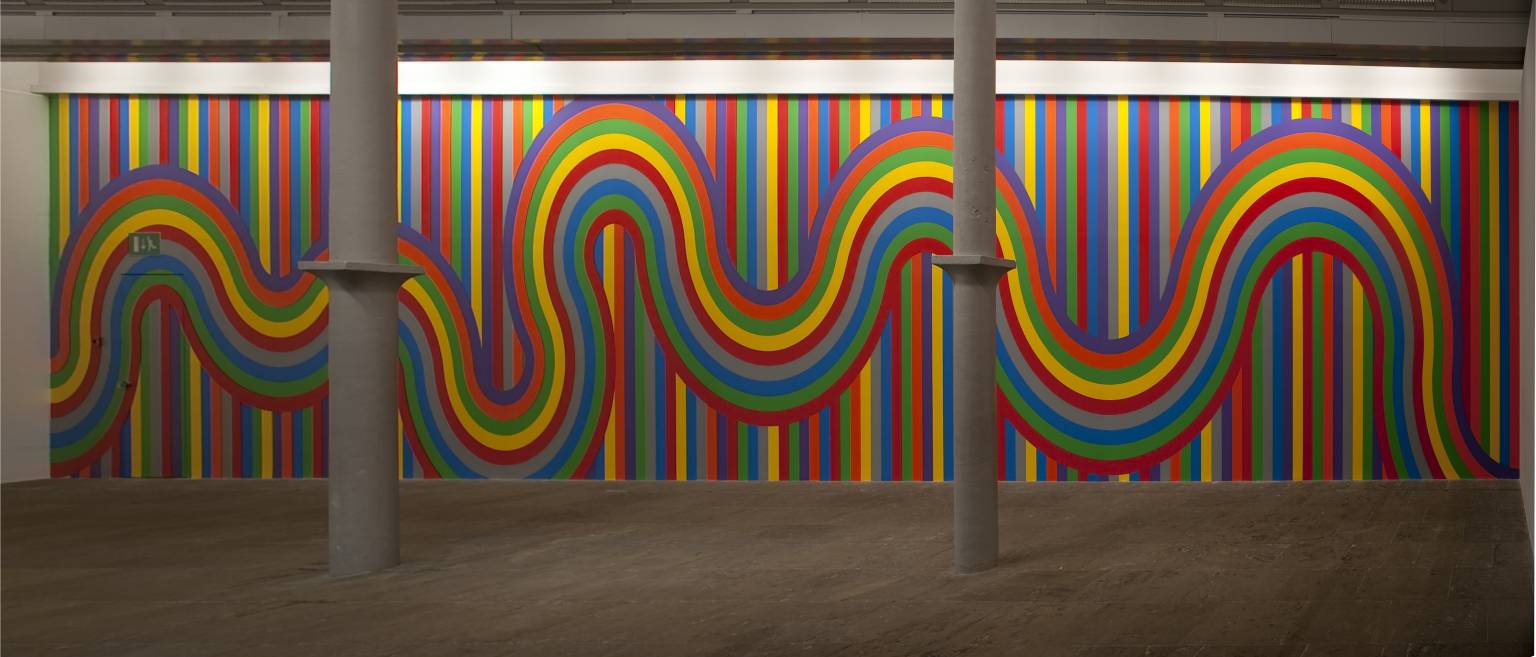
I thought that perhaps it would be a bit more difficult than the others I had done, since I had to deal with an irregular curve instead of lines and arcs, but I was unprepared for just how much of a pain it would prove to be.
The Instructions
There are several pictures of 1136 available on the web, but it's much easier to work with the full instructions, as I had with the other LeWitts I had done.
Here is what the Tate has to say about the work:
A letter of instruction, an installation diagram and a certificate pertaining to Wall Drawing #1136 can be found in Tate Gallery Records (PC10.1 LeWitt, Sol)... The diagram is a small colour inkjet print that lays out the pattern of the wall drawing in one continuous elongated horizontal band.
I contacted the librarians at the Tate to ask if I could see the installation diagram, but they declined and responded by emphasizing this portion of the summary:
Please be advised that the documents are the signature for the Wall Drawing and must accompany the Wall Drawing if it is sold or otherwise transferred. They represent the transfer of ownership from the artist to you … Under no circumstances will we issue a new certificate!
To me, this suggests that the documents must accompany the sale of the artwork, but not that showing me a copy would constitute a transfer of the work. I am disappointed with the unwillingness of a public (albeit funded by a government different than my own) institution to share information about the artwork and skeptical that it would be actually damaging to anyone.
It seemed that I would not be able to work with the official instructions, but I carried on as best I could.
(If anyone cares to go to the Tate Library and ask about seeing the instructions, I would be forever grateful! Please drop me a line if you do.)
The Drawing
The first step was simple but tedious: transcribe the color sequence of equal width lines that make up the background of the work. In case anybody else ever needs it, here is the sequence, where G is green, Y yellow, B blue, O orange, R red, P purple, and E grey:
GYBOPERBYGERPGYBOERBGYPOBGRPEYBGOPYBERPOGBYPREOGYBOERPBYOPGEBRY
BEOPRGBEYRGPOBRGOYEBRGOPYBERGORBEYBOPGRBPEYBRPGOGBYEPORGEBPYRGO
PEYGPOREBYPGBROGYBR
To generate this sequence and ensure it was correct, I simply opened an image of the work in photoshop and annotated it with the text tool so that I could check to avoid mistranslations.
Next, however came the curve. Or, as I would find out, the 9 curves.
I took the best image of 1136, which I've embedded above, cropped it and fixed the perspective as best I could, creating a base image for tracing the curve.
I had hoped that I would be able to "cheat" by doing something clever like tracing the curve once, then drawing it 9 times in different widths. I was unfortunately never able to come up with a clever way to have different colors on a curve in the way that this curve goes.
Once I realized that I needed 9 curves, my naïve first guess was to just try and trace one curve, then subtract a fixed amount from it to make the curve above it. The total failure of this method led me to the understanding that each of the 9 curves was in fact a different curve, and that perhaps I needed to understand a bit more about bezier curve offsetting than I did.
fail.
I looked into bezier offsetting, and found a rich literature which I will sum up by saying that it's impossible in the general case, and possible but difficult to estimate in practice.
After I implemented a lousy version of the Tiller-Hanson approximation algorithm, I was fortunate enough to find the bezier.js library which was capable of handling all the tricky bits for me.
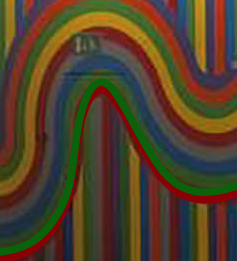
Finally I had the tools to set up a shim for tracing the curve; go there and play around with the very slow control point editor to get a feel for the slow, painful process of editing the curve to match LeWitt.
Once I got that looking as close as I felt like getting it, even though there are still some serious warts with the curve, I copied the paths out of the SVG using the Chrome inspector, and used those as the magic paths you can see in the source.
I cannot unsee this
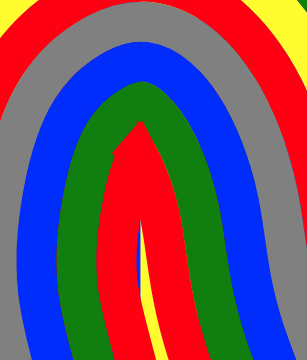
bad join but I'm also not willing to fix it.
Conclusion
This project took me much, much longer than I expected. I'm glad I got it out eventually, even if all I can see are the ways it could be improved.
I'm sure that some person would find an easy way to solve it! Like tracing it in Illustractor or Inkscape and just using those curves; but I was unwilling to use a drawing tool, and that unwillingness got me to learn some new algorithms.
I hope you like the piece, and if you're interested in doing a Sol, I highly recommend it. Go check out the repo and have at it. Many of them can be completed in just an hour or two, but others might lead you on a a bit of a journey.